Understanding the Stochastic Oscillator
The Stochastic Oscillator is a momentum indicator used in technical analysis to compare a particular closing price of an asset to a range of its prices over a certain period. Developed by George Lane in the 1950s, it helps traders identify potential overbought and oversold conditions in the market. Unlike indicators that primarily track price or volume, the Stochastic Oscillator focuses on the speed or momentum of price changes.
How it Works
The oscillator is typically represented by two lines, %K and %D. %K represents the current closing price’s position relative to the high-low range over the look-back period. It’s calculated as follows:
%K = ((Current Close – Lowest Low) / (Highest High – Lowest Low)) * 100
Where:
- Current Close is the most recent closing price.
- Lowest Low is the lowest price over the look-back period (typically 14 periods).
- Highest High is the highest price over the look-back period (typically 14 periods).
%D is a simple moving average of %K, usually calculated over 3 periods. It acts as a signal line, smoothing out the volatility of %K and providing clearer buy/sell signals.
%D = 3-period SMA of %K
Interpreting the Stochastic Oscillator
The Stochastic Oscillator fluctuates between 0 and 100. The primary interpretation involves identifying overbought and oversold levels. Generally:
- Readings above 80 are considered overbought, suggesting a potential price reversal downward.
- Readings below 20 are considered oversold, suggesting a potential price reversal upward.
However, it’s important to remember that overbought/oversold conditions can persist for extended periods, particularly in strong trending markets. Therefore, relying solely on these levels can lead to false signals.
Using the Stochastic Oscillator for Buy/Sell Signals
Crossovers between the %K and %D lines often generate buy and sell signals. A bullish signal occurs when %K crosses above %D, especially when both lines are below 20. Conversely, a bearish signal occurs when %K crosses below %D, particularly when both lines are above 80.
Another valuable signal is divergence. Bullish divergence occurs when price makes lower lows, but the Stochastic Oscillator makes higher lows, indicating weakening selling momentum and a potential reversal upward. Bearish divergence occurs when price makes higher highs, but the Stochastic Oscillator makes lower highs, suggesting weakening buying momentum and a potential reversal downward.
Limitations
Like all technical indicators, the Stochastic Oscillator is not foolproof. It can generate false signals, especially in volatile or choppy markets. It’s crucial to use it in conjunction with other technical analysis tools and fundamental analysis to confirm signals and reduce the risk of incorrect trading decisions. Furthermore, adjusting the look-back period can significantly affect the oscillator’s sensitivity; experimenting with different periods is often necessary to find the optimal setting for a particular asset.
Ultimately, the Stochastic Oscillator is a valuable tool for identifying potential turning points in the market and assessing the momentum of price movements. However, it should be used as part of a comprehensive trading strategy, not as a standalone indicator.
 772×1000 stochastic oscillator summary bad investment advice from badinvestmentsadvice.com
  646×544 stochastic oscillator investors yak from www.investorsyak.com
 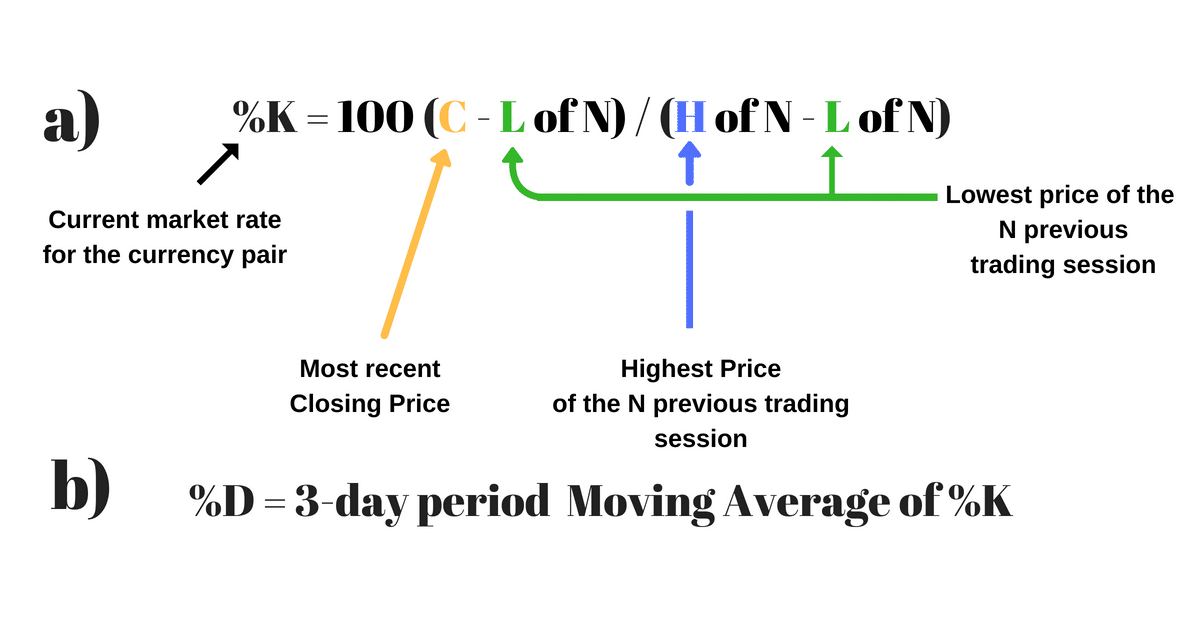 1200×627 stochastic oscillator indicator trading from learnpriceaction.com
  640×383 stochastic oscillator meaning trading ideas from top10stockbroker.com
  650×404 stochastic oscillator fxcodebasewiki from fxcodebase.com
 :max_bytes(150000):strip_icc()/dotdash_INV-final-Stochastic-Oscillator-Jun-2021-01-0580390daa1c44ffaac8c7ffcbb96f6a.jpg) 2729×1814 stochastic oscillator definition from www.investopedia.com
2729×1814 stochastic oscillator definition from www.investopedia.com  1024×486 stochastic oscillator technical indicator guide from www.asktraders.com